Compute and visualize ERDS maps#
This example is based on this MNE-Python example, which also provides some background information on event-related (de)synchronization (ERDS).
Download data#
Download data files for runs 6, 10, and 14 of subject 1 from the EEG Motor Movement/Imagery Dataset:
Load data sets#
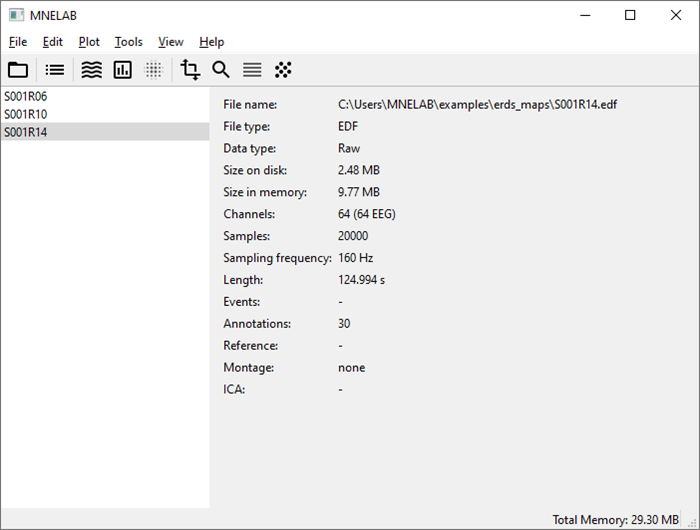
In MNELAB, select File – Open…, pick the three downloaded files and click Open. The three data sets appear in the sidebar. The data set loaded last (“S001R14”) is highlighted, indicating that it is currently active. The info panel on the right shows information about the active data set.
Concatenate data#
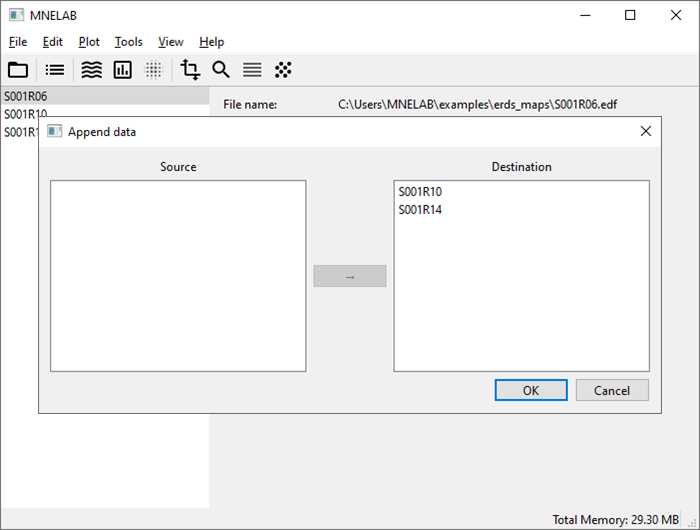
We want to concatenate the three data sets, starting with S001R06. In the sidebar, select S001R06, then go to Edit – Append data… to open the corresponding dialog. Select S001R10 and S001R14 in the Source panel; to select multiple items, hold Ctrl (⌘ on macOS) while clicking. Drag the selected data sets to the Destination panel (or click on the arrow button in the middle) and confirm with OK. A new entry appears in the sidebar: “S001R06 (appended)”. Rename it to “S001” by double-clicking the sidebar entry, entering the new name, and confirming with Return. The entries Samples and Length in the info panel confirm that it is indeed the result of the concatenation. To close the original data sets, select each one in the sidebar and click File – Close.
Convert annotations to events#
Splitting the raw data into epochs requires events. The info panel shows that the data set already contains annotations, but no events. To convert annotations to events, select Tools – Create events from annotations. The Events entry in the info panel now updates to “90 (1, 2, 3)”, indicating there are a total of 90 events with IDs 1, 2, and 3, which correspond to:
1 (annotation T0): rest
2 (annotation T1): onset of hand motor imagery
3 (annotation T2): onset of feet motor imagery
Split into epochs#
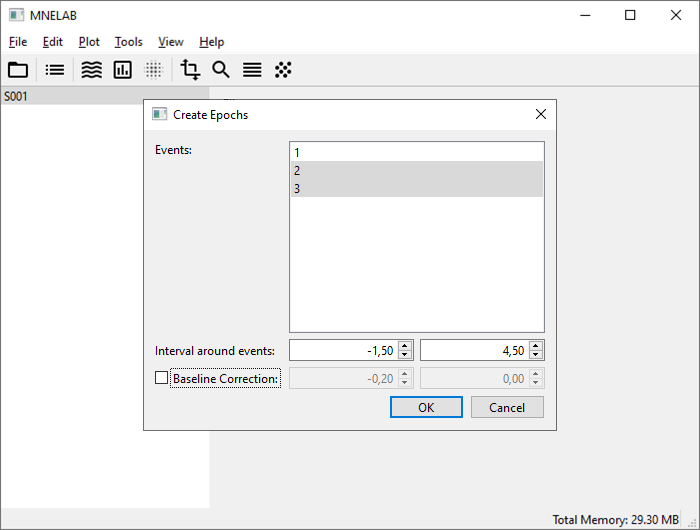
Go to Tools – Create Epochs… (or click on the corresponding icon in the toolbar). In the dialog, select events “2” and “3” (the two task onsets). You can click and drag to select multiple items in this dialog. For Interval around events enter “-1.5” and “4.5” as start and end times relative to the selected events, respectively. We will create ERDS maps in the time interval ranging from -1 to 4 seconds, but we add half a second at the start and end to account for edge effects. Uncheck Baseline Correction, confirm with OK, and select Create a new data set. In the info panel, the Data type of the newly created data set (“S001 (epoched)”) is now Epochs. If you select the original data set, you’ll see that it is of type Raw. ERDS maps can only be calculated from Epochs.
Pick channels#
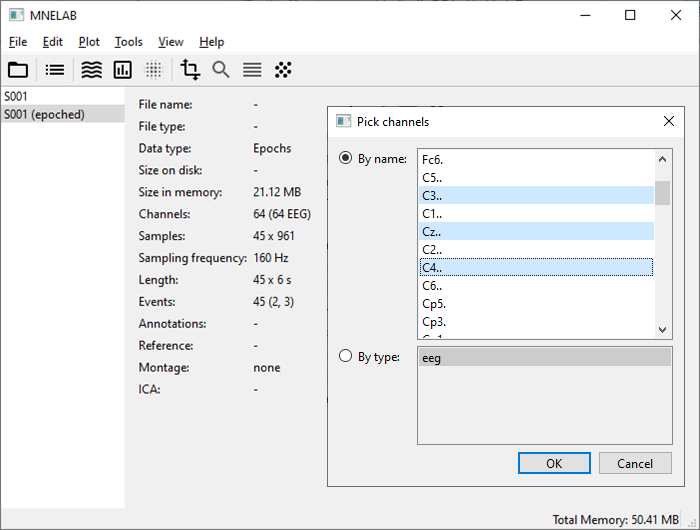
Considering the motor imagery tasks, electrodes C3, Cz, and C4 should show the strongest activity. Go to Edit – Pick channels… and select the desired channels. Don’t worry about the channel names containing trailing dots, that’s how they are stored in the original data files.
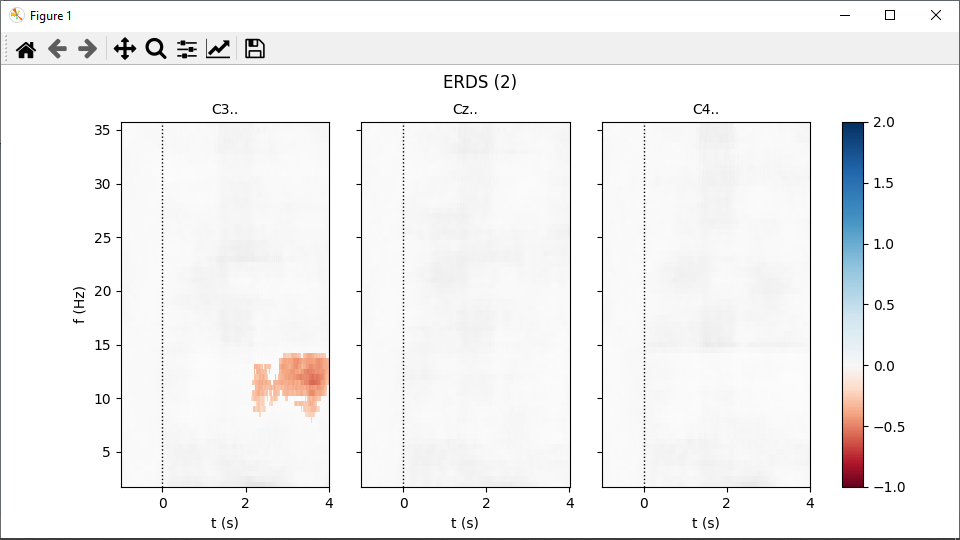
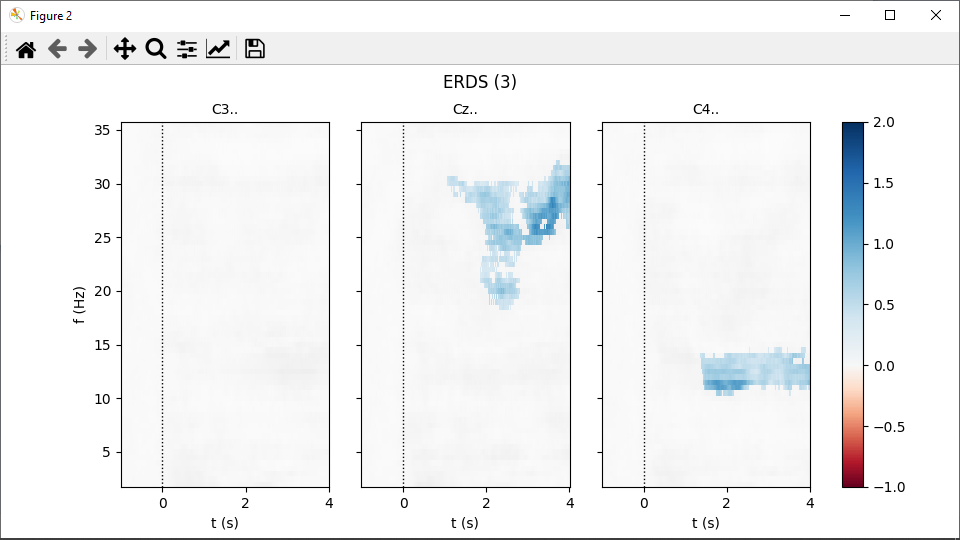
Plot ERDS maps#
Select Plot – Plot ERDS maps… and enter the following values:
Frequency range: “2” to “36”
Step size: “0.5”
Time range: “-1” to “4”
Baseline: “-1” to “0”
Check Significance level, leave the value at “0.05” and confirm with OK. This will determine significant pattern in the maps using a cluster permutation test.
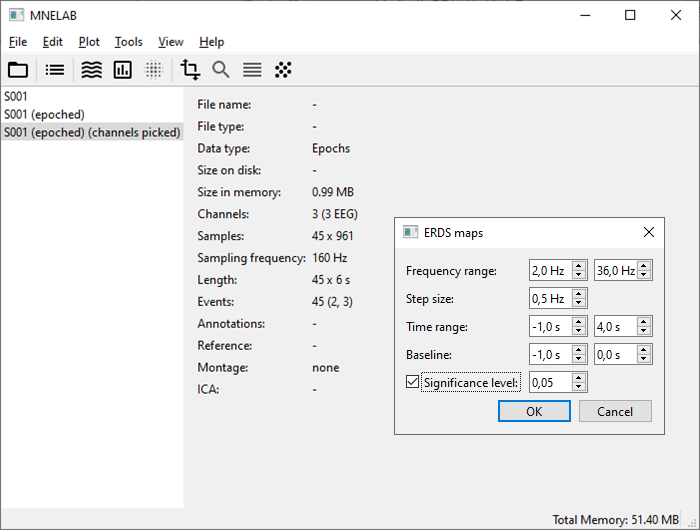
Calculating the significance masks can take about a minute. Eventually, two figures pop up, one per event type: