Settings
MNELAB can be customized in various ways to suit your preferences and workflow. In this section, we will cover the basic settings available in MNELAB and how to configure them.
View Menu
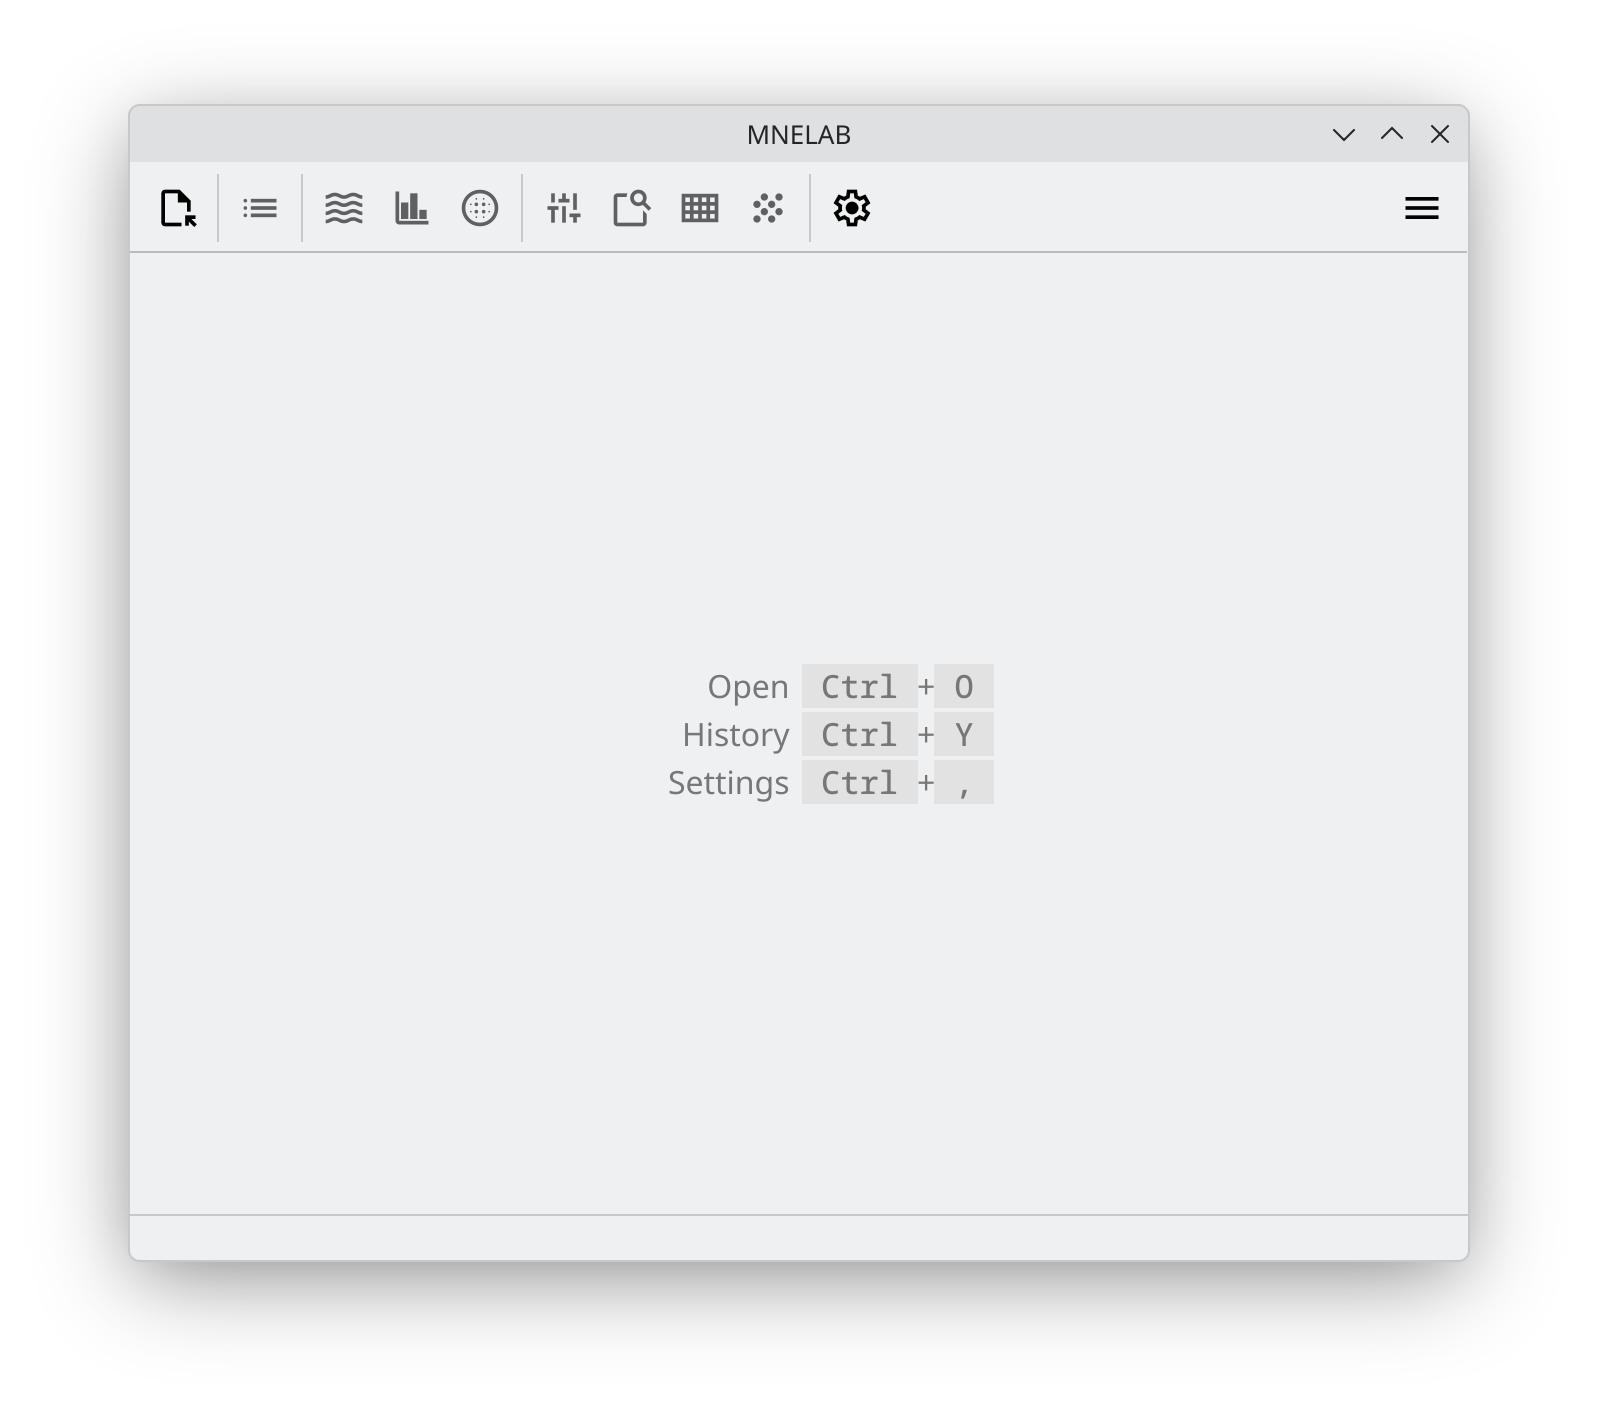
First, the View menu contains an option to toggle the status bar. On Linux and Windows, it is also possible to toggle the menu bar. If the menu bar is hidden, a hamburger menu will appear in the top right corner of the toolbar instead.
Settings
The Settings menu contains three main sections: General, Plotting, and Toolbar. Note that you can always revert to the default settings by clicking the Reset to Defaults button. Let's now go through each of these sections in detail.
General
The General section groups options related to the overall behavior of MNELAB.
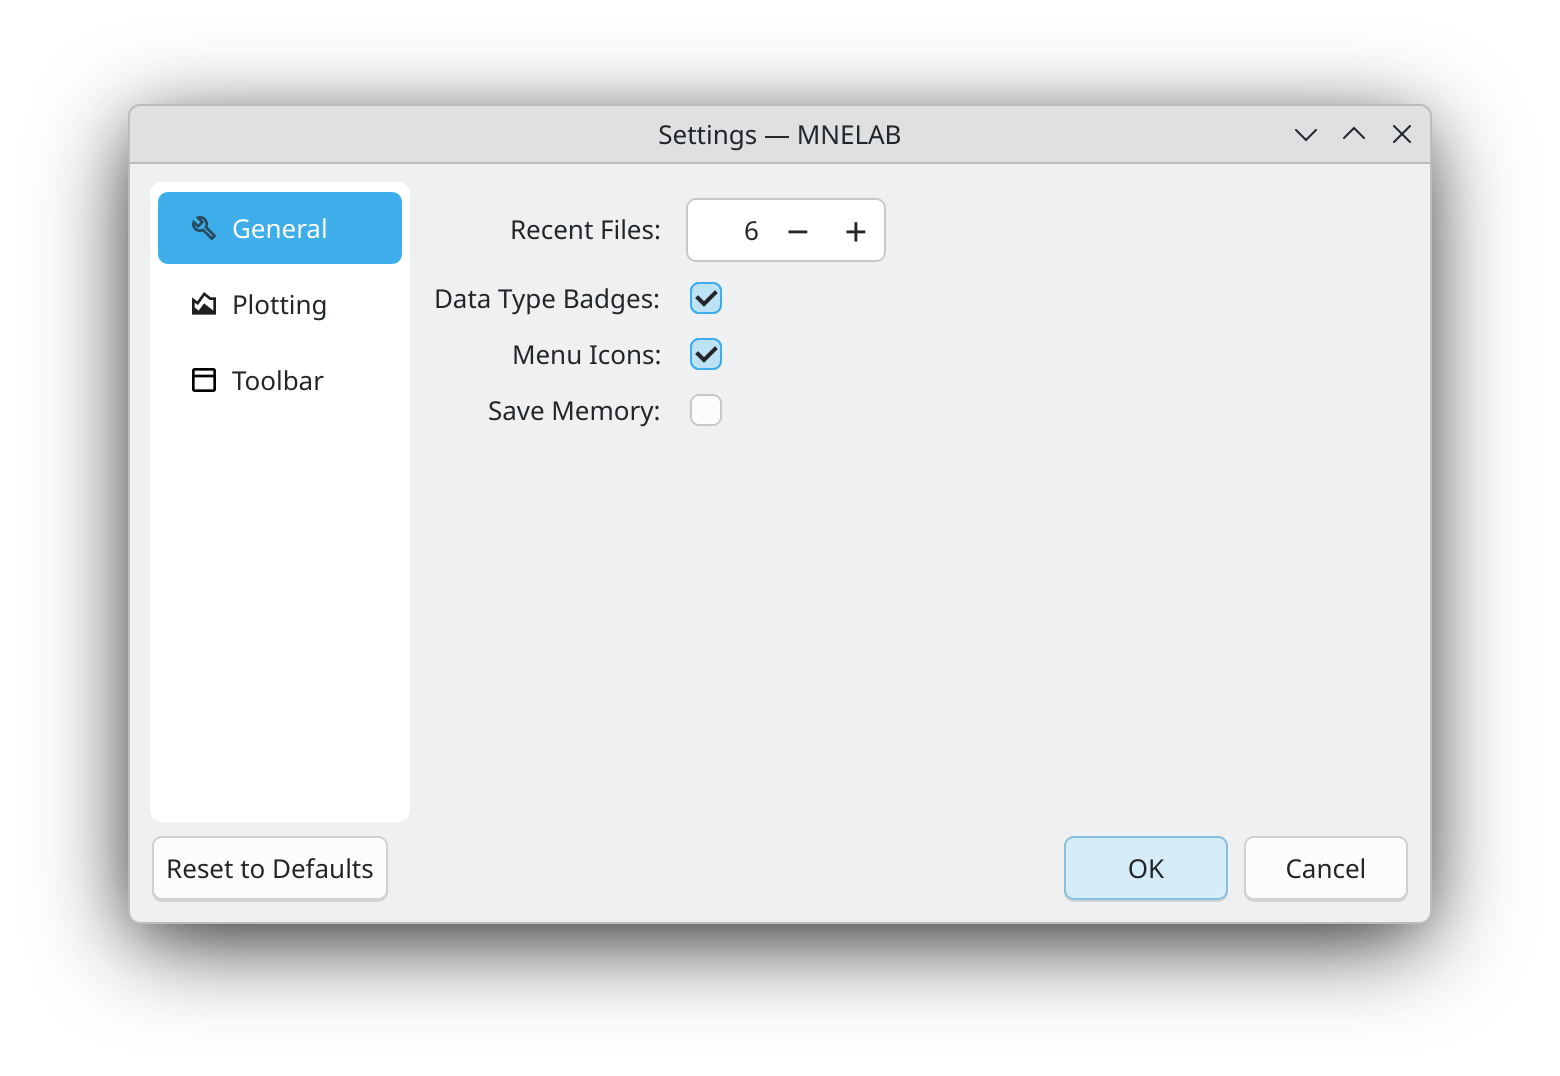
The Recent Files option allows you to specify how many recently opened files should be displayed in the File menu for quick access.
The Data Type Badges option enables or disables the display of data type badges (e.g., "Raw", "Epochs") next to open datasets in the sidebar.
The Menu Icons option allows you to toggle icons in menus. Note that if you change this setting, you will need to restart MNELAB for the change to take effect.
Finally, the Save Memory option influences how MNELAB handles open datasets. If enabled, only the currently active dataset will be fully loaded into memory. This can be useful if you are working with many large datasets and want to reduce memory usage. However, keep in mind that switching between datasets may take slightly longer when this option is enabled.
Plotting
The Plotting section contains options related to the appearance of plots in MNELAB.
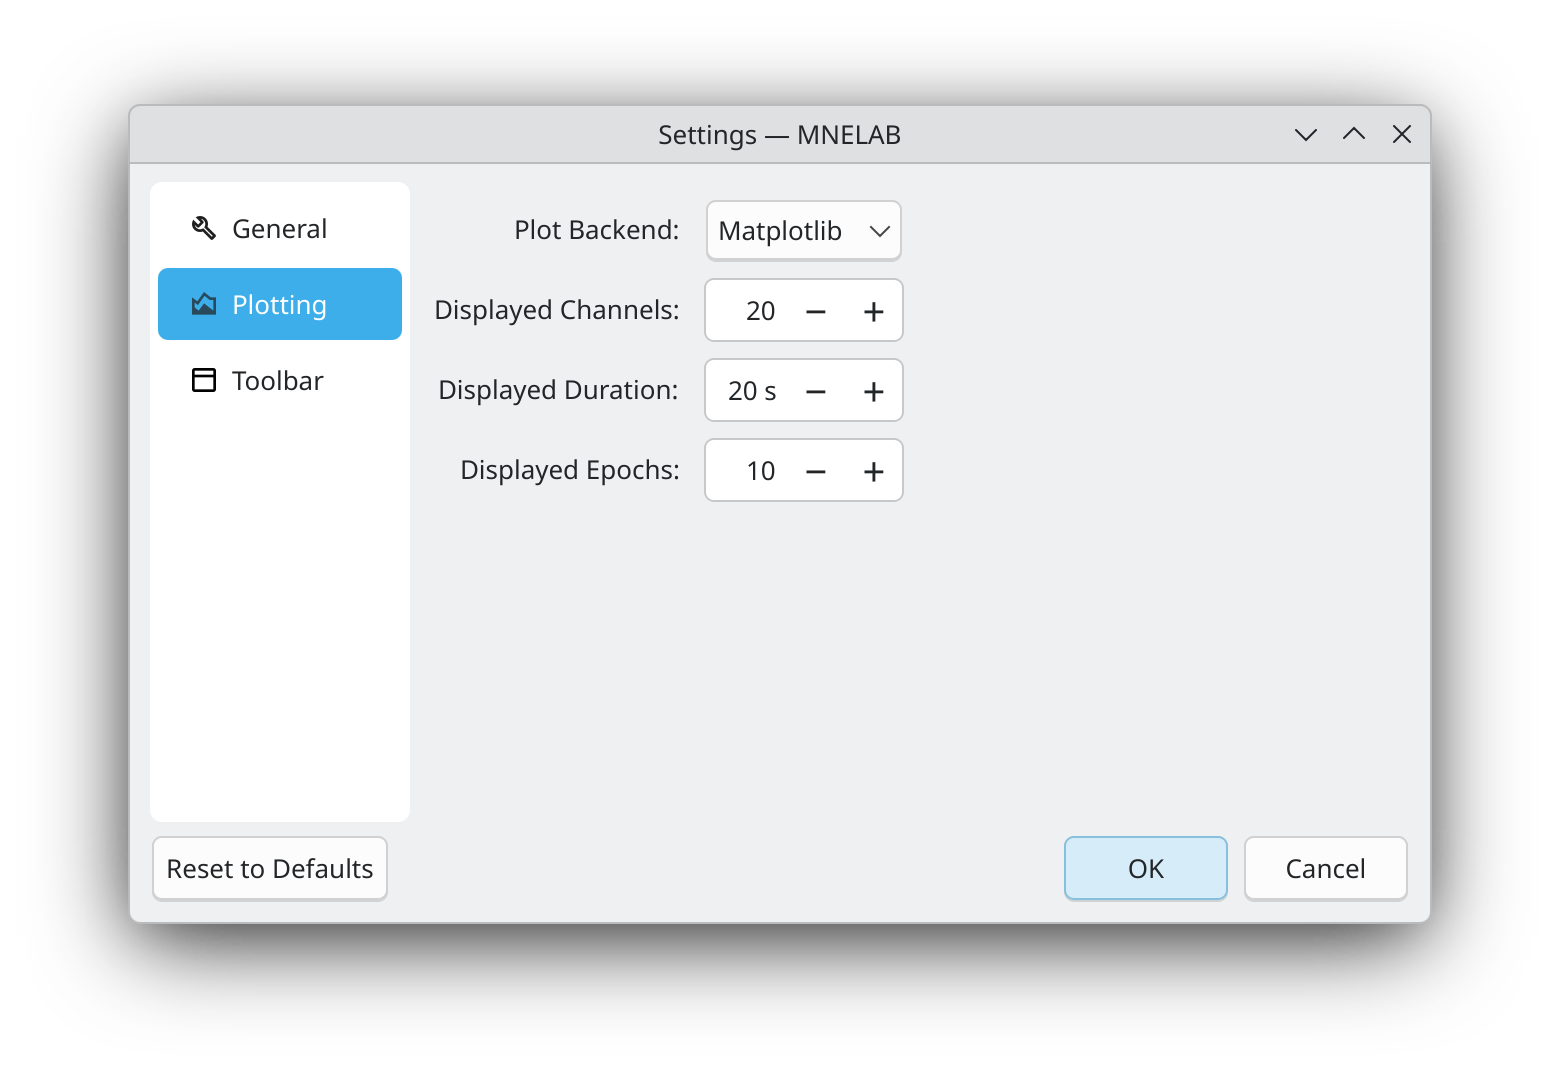
The Plot Backend option allows you to choose between two different plotting backends for the data browser: Matplotlib and Qt. Whereas the Matplotlib backend provides a more traditional user experience, the Qt backend offers a more modern and possibly also more responsive interface.
The other options in this section allow you to customize the default appearance of the data browser, namely the number of displayed channels, the displayed signal duration on a single page, and if you are visualizing epochs, the number of epochs shown at once. Of course, these settings can be adjusted on a per-plot basis in the data browser itself, but they will be used as defaults when opening new plots.
Toolbar
The Toolbar section allows you to customize the appearance of the toolbar in MNELAB.
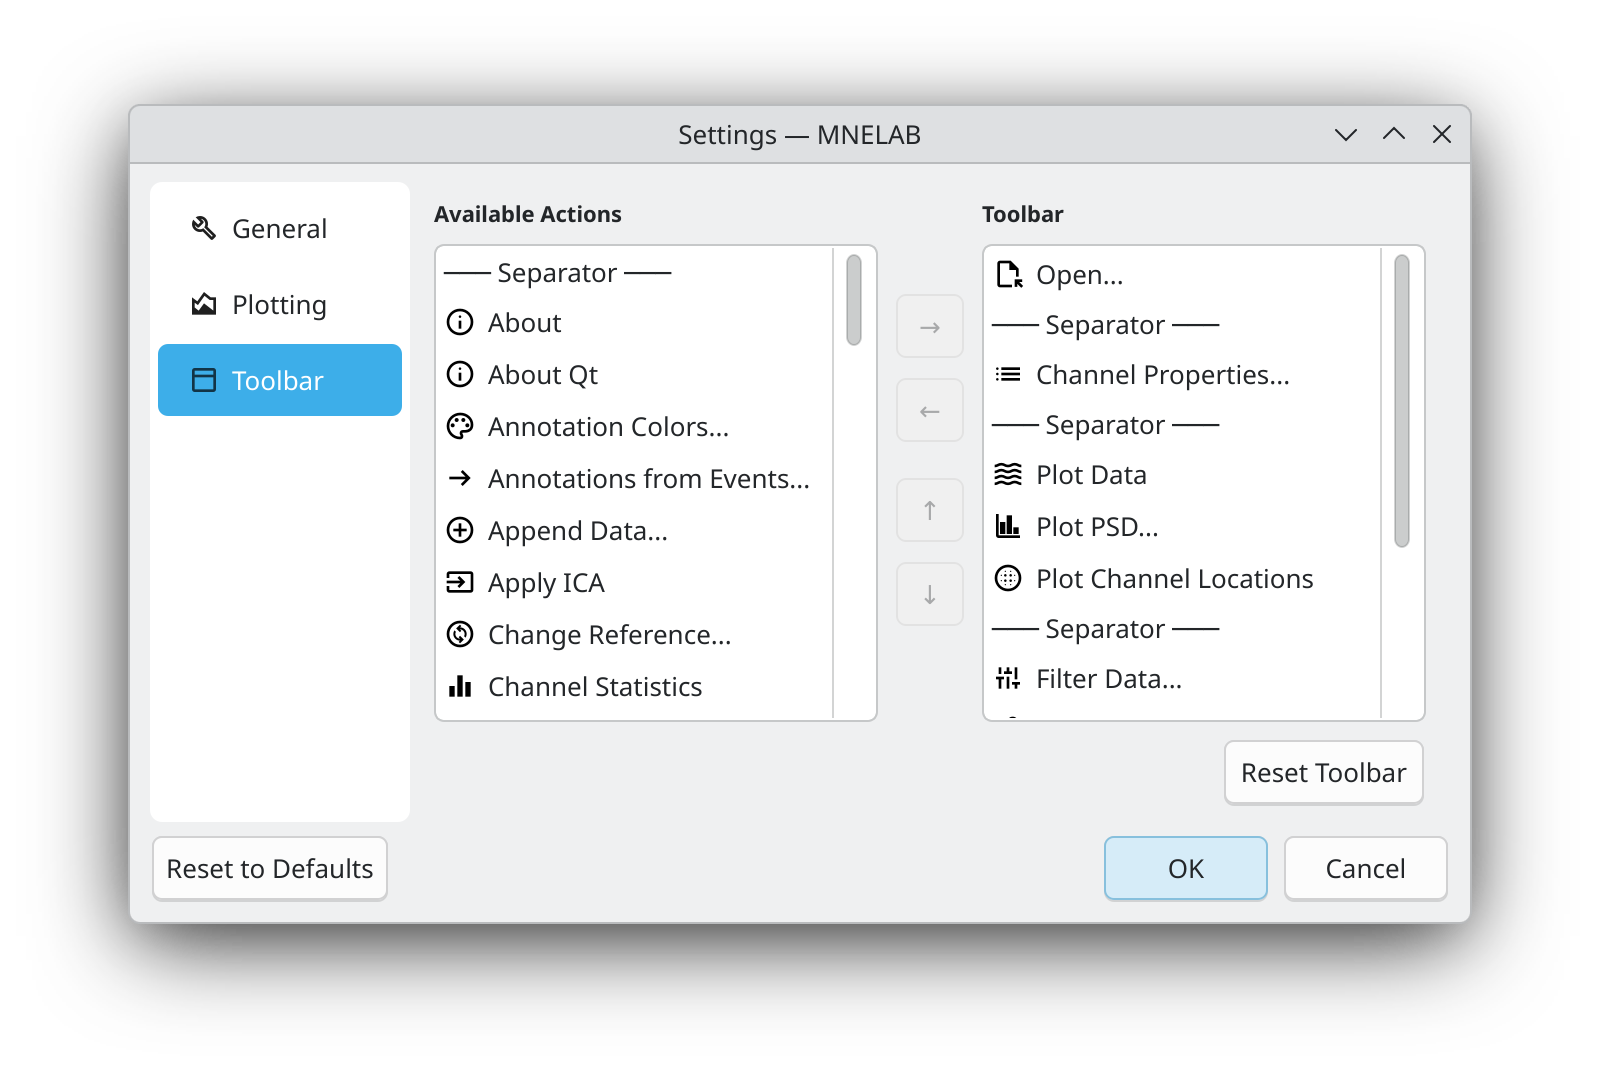
The Available Actions list on the left contains all the actions that can be added to the toolbar, whereas the Toolbar list on the right shows the actions that are currently included in the toolbar. To add an action to the toolbar, simply select it in the Available Actions list and click the right arrow button. To remove an action from the toolbar, select it in the Toolbar list and click the left arrow button. You can also rearrange the order of actions in the toolbar by selecting an action in the Toolbar list and using the up and down arrow buttons to move it.
If you want to reset the toolbar to its default configuration, simply click the Reset Toolbar button.